

Municipality in the Canton of Zurich
Living in Wallisellen
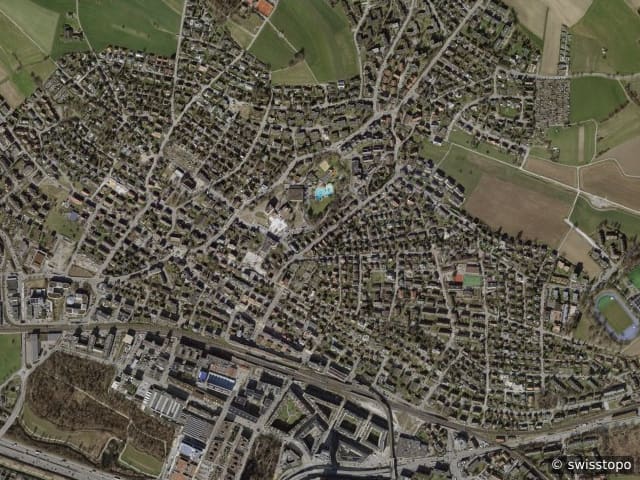
Wallisellen (postcode 8304) has 2,059 residential buildings with 8,640 homes in total on 139 streets.
- homes
- 8,640
- with a supermarket ≤ 500 m
- 68%
- with public transport ≤ 300 m
- 98%
- in a quiet location
- 0%
Overview
Wallisellen in figures
- Wallisellen (postcode 8304) has 2,059 residential buildings with 8,640 homes in total on 139 streets.
- The average construction year of the residential buildings is 1962.
- 68% of residential buildings have a supermarket within 500 m as the crow flies, 96% a daycare centre or kindergarten and 98% a public transport stop within 300 m.
- 0% of residential buildings are in a quiet location (below 50 dB during the day at the loudest façade).
- Building land in Wallisellen: Model value 2025 of 3,373 CHF per m² of land.
- Net rents in the Canton of Zurich are 21.30 CHF per m² per month (average, 2024; BFS, Strukturerhebung (Durchschnitt aller bewohnten Mietwohnungen)).
- Owner-occupied flats in Wallisellen sold at a median price of CHF 1.43m in 2025 (45 sales).
- Income tax (canton and municipality): about CHF 8,417 per year for a single person with a gross income of about CHF 100,000.
Find your address in Wallisellen
Market & people
Prices, population and building stock
Building land
Model value3,373 CHF/m²
per m² of land
Wallisellen · 2025
- Canton of Zurich1,742 CHF/m²
Rents
Official survey21.30 CHF/m²
per m² of living space per month, net
Canton of Zurich · 2024
Canton value – not published for Wallisellen
- Switzerland17.80 CHF/m²
Owner-occupied flats
Sale pricesCHF 1.43m
per flat (median price)
Wallisellen · 2025 · 45 sales
- Canton of ZurichCHF 1.20m
Single-family houses
Sale pricesCHF 1.75m
per house (median price)
Wallisellen · 2025 · 19 sales
- Canton of ZurichCHF 1.59m
Vacancy rate
Full census1.23%
of dwellings are vacant
Wallisellen · 2026 · 106 vacant dwellings
- Canton of Zurich0.52%
3,373 CHF/m²
Building land per m² of land · Wallisellen · 2025
+1499 %
since 1974
Line: median · band: middle 50%
All values as a table
| Year | Value | 25 % | 75 % | Cases |
|---|---|---|---|---|
| 2025 | 3,373 CHF/m² | 2,396 CHF/m² | 4,753 CHF/m² | 1 |
| 2024 | 3,245 CHF/m² | 2,304 CHF/m² | 4,572 CHF/m² | 1 |
| 2023 | 3,090 CHF/m² | 2,197 CHF/m² | 4,349 CHF/m² | 3 |
| 2022 | 2,579 CHF/m² | – | – | 4 |
| 2021 | 2,973 CHF/m² | – | – | 4 |
| 2020 | 2,000 CHF/m² | 1,148 CHF/m² | 2,167 CHF/m² | 7 |
| 2019 | 2,218 CHF/m² | 1,585 CHF/m² | 3,116 CHF/m² | 1 |
| 2018 | 2,009 CHF/m² | 1,437 CHF/m² | 2,823 CHF/m² | 1 |
| 2017 | 3,439 CHF/m² | 3,098 CHF/m² | 3,669 CHF/m² | 5 |
| 2016 | 1,666 CHF/m² | 1,196 CHF/m² | 2,339 CHF/m² | 3 |
| 2015 | 1,562 CHF/m² | 1,123 CHF/m² | 2,196 CHF/m² | 1 |
| 2014 | 1,469 CHF/m² | 1,057 CHF/m² | 2,069 CHF/m² | 3 |
| 2013 | 1,302 CHF/m² | 1,083 CHF/m² | 1,592 CHF/m² | 9 |
| 2012 | 1,404 CHF/m² | 1,395 CHF/m² | 1,469 CHF/m² | 5 |
| 2011 | 1,144 CHF/m² | 820 CHF/m² | 1,609 CHF/m² | 1 |
| 2010 | 973 CHF/m² | 870 CHF/m² | 1,084 CHF/m² | 5 |
| 2009 | 981 CHF/m² | 702 CHF/m² | 1,377 CHF/m² | 2 |
| 2008 | 800 CHF/m² | 389 CHF/m² | 1,006 CHF/m² | 8 |
| 2007 | 938 CHF/m² | – | – | 4 |
| 2006 | 828 CHF/m² | 551 CHF/m² | 850 CHF/m² | 5 |
| 2005 | 847 CHF/m² | 795 CHF/m² | 850 CHF/m² | 9 |
| 2004 | 852 CHF/m² | 608 CHF/m² | 1,200 CHF/m² | 1 |
| 2003 | 800 CHF/m² | 642 CHF/m² | 875 CHF/m² | 10 |
| 2002 | 805 CHF/m² | 613 CHF/m² | 869 CHF/m² | 19 |
| 2001 | 594 CHF/m² | 549 CHF/m² | 762 CHF/m² | 7 |
| 2000 | 706 CHF/m² | 667 CHF/m² | 753 CHF/m² | 8 |
| 1999 | 720 CHF/m² | 671 CHF/m² | 754 CHF/m² | 23 |
| 1998 | 646 CHF/m² | 562 CHF/m² | 732 CHF/m² | 6 |
| 1997 | 883 CHF/m² | – | – | 4 |
| 1996 | 869 CHF/m² | 644 CHF/m² | 1,171 CHF/m² | 2 |
| 1995 | 883 CHF/m² | 658 CHF/m² | 1,186 CHF/m² | 3 |
| 1994 | 879 CHF/m² | 658 CHF/m² | 1,172 CHF/m² | 3 |
| 1993 | 890 CHF/m² | 669 CHF/m² | 1,184 CHF/m² | 1 |
| 1992 | 867 CHF/m² | 652 CHF/m² | 1,153 CHF/m² | 2 |
| 1991 | 1,373 CHF/m² | 1,259 CHF/m² | 1,393 CHF/m² | 8 |
| 1990 | 1,376 CHF/m² | 1,012 CHF/m² | 1,700 CHF/m² | 6 |
| 1989 | 1,099 CHF/m² | 999 CHF/m² | 1,276 CHF/m² | 6 |
| 1988 | 495 CHF/m² | – | – | 4 |
| 1987 | 420 CHF/m² | 402 CHF/m² | 720 CHF/m² | 10 |
| 1986 | 474 CHF/m² | 406 CHF/m² | 563 CHF/m² | 27 |
| 1985 | 396 CHF/m² | 300 CHF/m² | 458 CHF/m² | 16 |
| 1984 | 530 CHF/m² | 380 CHF/m² | 540 CHF/m² | 9 |
| 1983 | 300 CHF/m² | 286 CHF/m² | 300 CHF/m² | 15 |
| 1982 | 330 CHF/m² | 173 CHF/m² | 380 CHF/m² | 7 |
| 1981 | 281 CHF/m² | 175 CHF/m² | 330 CHF/m² | 15 |
| 1980 | 300 CHF/m² | 240 CHF/m² | 330 CHF/m² | 11 |
| 1979 | 276 CHF/m² | 209 CHF/m² | 315 CHF/m² | 22 |
| 1978 | 286 CHF/m² | 137 CHF/m² | 302 CHF/m² | 45 |
| 1977 | 312 CHF/m² | 266 CHF/m² | 322 CHF/m² | 45 |
| 1976 | 281 CHF/m² | 149 CHF/m² | 304 CHF/m² | 23 |
| 1975 | 300 CHF/m² | 239 CHF/m² | 332 CHF/m² | 16 |
| 1974 | 211 CHF/m² | 201 CHF/m² | 298 CHF/m² | 9 |
Sale prices: Prices actually paid in property transfers · Official survey: Sample of existing tenancies · Full census: Official count · Model value: Statistical estimate, no individual transactions.
Sources: Statistisches Amt Kanton Zürich, Handänderungsstatistik; BFS, Strukturerhebung (Durchschnitt aller bewohnten Mietwohnungen); Statistisches Amt Kanton Zürich, Leerwohnungszählung. Values apply to the area named, not to an individual building.
Population & jobs
- Residents (2025)
- 17,765
- Growth over 10 years
- +15.6%
- Share of foreign nationals
- 33.0%
- Share aged 65 and over
- 15.7%
- Jobs (2024)
- 21,107
- Income tax¹
- CHF 8,417
- Household electricity price (2027)
- from 28.5 Rp./kWh
Sources: FSO (STATPOP, STATENT), ElCom. ¹ Canton and municipality, single person, gross income of about CHF 100,000.
Residential buildings by construction period
- before 1919 198
- 1919–1945 328
- 1946–1970 538
- 1971–1990 463
- 1991–2010 329
- from 2011 202
Heating systems in the existing stock
- Heat pump 19%
- District heating 4%
- Gas 46%
- Heating oil 22%
- Wood 3%
Source: GWR, residential buildings in Wallisellen.
Streets compared
What is it like to live where in Wallisellen?
The quietest streets
- 1.Blumenweg57 dB
- 2.Butzenstrasse57 dB
- 3.Hochrütistrasse57 dB
- 4.Schönbüelstrasse57 dB
- 5.Zielackerstrasse57 dB
- 6.Allmendstrasse58 dB
- 7.Bachtelstrasse58 dB
- 8.Brandenbergstrasse58 dB
Shops & public transport on the doorstep
- 1.Zwirnereistrasse40 m · 60 m
- 2.Bahnhofstrasse50 m · 70 m
- 3.Querstrasse60 m · 70 m
- 4.Lindenstrasse120 m · 60 m
- 5.Archengässli100 m · 100 m
- 6.Seidenplatz160 m · 50 m
- 7.Kirchstrasse100 m · 130 m
- 8.Rotackerstrasse120 m · 110 m
Short walks to daycare & kindergarten
- 1.Konradstrasse40 m
- 2.Im Schwanen50 m
- 3.Alter Kirchenweg60 m
- 4.Richtiarkade60 m
- 5.Südstrasse70 m
- 6.Im Wiesengrund70 m
- 7.Zentralstrasse80 m
- 8.Bahnhofstrasse80 m
Streets with at least three residential buildings; median of the buildings. Noise: loudest façade during the day (FOEN sonBASE); distances as the crow flies (OpenStreetMap, FOT).
Currently on Heimster
10 listings in Wallisellen
Buy
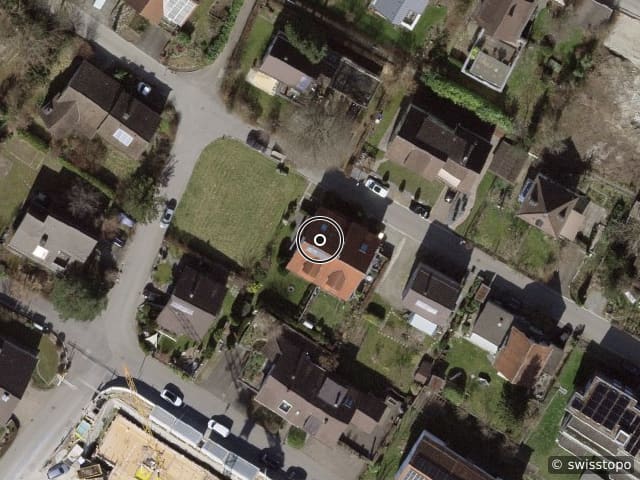
6.5 Zimmer Doppeleinfamilienhaus
CHF 2.50m
6.5 rooms · 189 m² · Wallisellen
Listing by ImmoMenu AG
Buy
Schlüsselfertiges 4½ Zimmer-Doppeleinfamilienhaus mit Garten in Wallisellen
CHF 2.48m
4.5 rooms · Wallisellen
Listing by Früh Immobilien Dienstleistungen AG
Buy
Attraktives Dreifamilienhaus mit grossem Garten in Wallisellen.
CHF 2.49m
759 m² · Wallisellen
Listing by Früh Immobilien Dienstleistungen AG
Buy
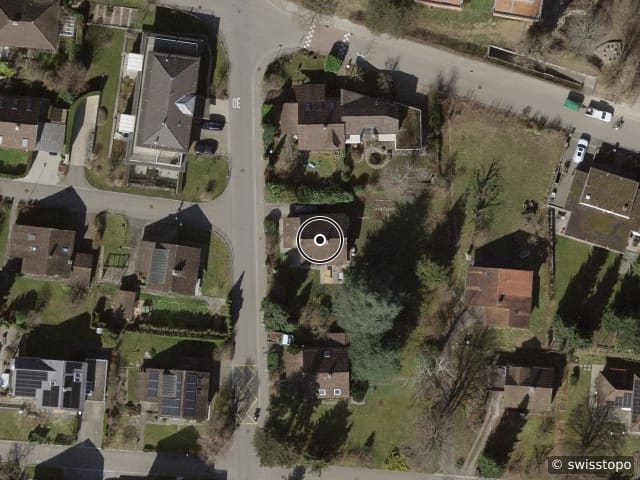
Floréa - Leben am Blumenweg
CHF 2.49m
4.5 rooms · 148 m² · Wallisellen
Listing by Walde Immobilien AG
Buy
Mono | Wallisellen ZH
Price on request
4.5 rooms · 200 m² · Wallisellen
Listing by Property One Partners AG
Buy
Floréa - Wohnen am Blumenweg
CHF 1.53m
148 m² · Wallisellen
Listing by Walde Immobilien AG
New builds
What is being created in Wallisellen
360 new homes are under construction, approved or planned here – from the federal building register.
 On the market
Brandenbergstrasse 18
Wallisellen
1 offer · from CHF 2'060'000
Offered by Walde Immobilien AG
Schwarzackerstrasse 6–10
Wallisellen
76 flats
Public transport class A
Opfikonerstrasse 35–39
Wallisellen
48 flats
Spitzackerstrasse 10
Wallisellen
17 flats
For owners
Your property at a glance.
Value it yourself and follow the value in your cockpit – or get advice from an experienced expert in your region. Both are free and without obligation.
Value it yourself – with an owner cockpit
Free, in about two minutes. Afterwards you follow the value for as long as you like.
Prefer personal advice?
An experienced agency from your region looks at your property, values it on site and supports the sale or letting – free and without obligation. We put you in touch.
Owner-occupied flats in Wallisellen sold at a median price of CHF 1.43m in 2025 (45 sales).
- 1Send an enquiry – two minutes, no account.
- 2We get back to you within two working days and choose a suitable estate agency from your region.
- 3Personal assessment on site – free of charge and without obligation.
Streets
Streets in Wallisellen
139 streets with residential buildings – location, distances and noise for every building.
A
- Allmendstrasse · 22
- Alpenstrasse · 5
- Alte Winterthurerstrasse · 61
- Alter Kirchenweg · 4
- Archengässli · 5
B
- Bachtelstrasse · 12
- Bahnhofstrasse · 19
- Beetlistrasse · 8
- Bellariasteig · 2
- Bellariastrasse · 1
- Bergliweg · 20
- Birgistrasse · 1
- Blumenweg · 7
- Bodenackerstrasse · 30
- Brandenbergstrasse · 23
- Brandholzweg · 2
- Breitestrasse · 12
- Brunnenstrasse · 2
- Bubentalstrasse · 8
- Butzenstrasse · 12
- Bürglistrasse · 30
- Bützackerstrasse · 10
C
- Churfirstenstrasse · 15
D
- Dietlikonerstrasse · 25
E
- Eigenheimstrasse · 21
- Einfangstrasse · 11
- Engenbüelstrasse · 12
- Erikastrasse · 14
- Escherweg · 5
F
- Favreweg · 6
- Feldstrasse · 7
- Fliederstrasse · 10
- Florastrasse · 4
- Friedenstrasse · 23
- Frohheimstrasse · 30
- Fuchsrain · 4
- Furtbachweg · 33
- Färbereigasse · 1
- Föhrlibuckstrasse · 9
G
- Gartenheimstrasse · 11
- Gartenstrasse · 9
- Geerenstrasse · 7
- Gewerbehallenstrasse · 1
- Glärnischstrasse · 13
- Grabenstrasse · 6
- Grindelstrasse · 1
- Grundackerstrasse · 13
- Guggenbühlstrasse · 20
- Guyerstrasse · 11
H
- Haldenstrasse · 7
- Hammerweg · 2
- Hardstrasse · 13
- Heinrichstrasse · 13
- Herrengütlistrasse · 30
- Hertistrasse · 9
- Herzogenmühle · 4
- Hochrütistrasse · 6
- Hofackerstrasse · 13
- Hofstrasse · 1
- Hueberstrasse · 19
- Höhenstrasse · 73
- Hörnlistrasse · 4
I
- Im Bachofen · 12
- Im Breitenacker · 8
- Im Buchenpark · 4
- Im Glattgarten · 12
- Im Holzacker · 10
- Im Langacker · 29
- Im Mösli · 7
- Im Rebenbuck · 7
- Im Schwanen · 7
- Im Spitz · 7
- Im Waldheim · 5
- Im Wiesengrund · 10
- In den Pünten · 2
- In den Weissenäckern · 11
- Industriestrasse · 9
K
- Kiesackerstrasse · 8
- Kirchstrasse · 4
- Klotenerstrasse · 18
- Konradstrasse · 3
- Kriesbachstrasse · 2
- Krummgasse · 8
L
- Langenwiesenstrasse · 4
- Lindenstrasse · 10
- Lägernstrasse · 24
M
- Margritstrasse · 13
- Mattengasse · 2
- Melchrütistrasse · 60
N
- Nelkenstrasse · 11
- Neue Winterthurerstrasse · 8
- Neugutstrasse · 24
- Neuwiesenstrasse · 7
- Nordstrasse · 3
O
- Obere Kirchstrasse · 39
- Oberrebenweg · 31
- Opfikonerstrasse · 41
P
- Parkstrasse · 5
- Pfadhagstrasse · 25
- Püntengasse · 4
Q
- Querstrasse · 4
R
- Rennweg · 1
- Reservoirstrasse · 17
- Richtiarkade · 14
- Richtiring · 7
- Richtistrasse · 7
- Riedenerstrasse · 61
- Rietwiesenstrasse · 27
- Rosenbergstrasse · 56
- Rotackerstrasse · 36
- Röslistrasse · 36
S
- Sandgrubstrasse · 41
- Schmittenackerstrasse · 15
- Schorenstrasse · 20
- Schulerweg · 5
- Schwarzackerstrasse · 31
- Schäfligrabenstrasse · 44
- Schönbüelstrasse · 18
- Schützenstrasse · 48
- Seidenplatz · 4
- Sonnhaldenstrasse · 3
- Speerstrasse · 9
- Spitzackerstrasse · 12
- Steinackerweg · 27
- Strangenstrasse · 6
- Sunnebüel · 2
- Säntisstrasse · 42
- Südstrasse · 10
T
- Talstrasse · 14
- Turnhallenstrasse · 1
- Tödistrasse · 30
- Türliackerstrasse · 12
W
- Weiherstrasse · 11
- Wiesgasse · 9
- Winkelstrasse · 6
Z
- Zentralstrasse · 7
- Zielackerstrasse · 28
- Zwicky-Strasse · 21
- Zwirnereistrasse · 11