

Municipality in the Canton of Zurich
Living in Niederweningen
Niederweningen (postcode 8166) has 744 residential buildings with 1,446 homes in total on 61 streets.
- homes
- 1,446
- with a supermarket ≤ 500 m
- 40%
- with public transport ≤ 300 m
- 32%
- in a quiet location
- 68%
Overview
Niederweningen in figures
- Niederweningen (postcode 8166) has 744 residential buildings with 1,446 homes in total on 61 streets.
- The average construction year of the residential buildings is 1978.
- 40% of residential buildings have a supermarket within 500 m as the crow flies, 60% a daycare centre or kindergarten and 32% a public transport stop within 300 m.
- 68% of residential buildings are in a quiet location (below 50 dB during the day at the loudest façade).
- Owner-occupied flats in Niederweningen were advertised at a median of 9,191 CHF per m² of living space in 2026 (11 listings, Asking prices).
- Building land in Niederweningen: Model value 2025 of 1,510 CHF per m² of land.
- Net rents in the Canton of Zurich are 21.30 CHF per m² per month (average, 2024; BFS, Strukturerhebung (Durchschnitt aller bewohnten Mietwohnungen)).
- Income tax (canton and municipality): about CHF 8,814 per year for a single person with a gross income of about CHF 100,000.
Find your address in Niederweningen
Market & people
Prices, population and building stock
Owner-occupied flats
Asking prices9,191 CHF/m²
per m² of living space
Median per flat: CHF 875,000
Niederweningen · 2026 · 11 listings
Building land
Model value1,510 CHF/m²
per m² of land
Niederweningen · 2025
- Canton of Zurich1,742 CHF/m²
Rents
Official survey21.30 CHF/m²
per m² of living space per month, net
Canton of Zurich · 2024
Canton value – not published for Niederweningen
- Switzerland17.80 CHF/m²
Single-family houses
Sale pricesCHF 1.16m
per house (median price)
Niederweningen · 2022 · 38 sales
- Canton of ZurichCHF 1.59m
Vacancy rate
Full census1.24%
of dwellings are vacant
Niederweningen · 2026 · 18 vacant dwellings
- Canton of Zurich0.52%
1,510 CHF/m²
Building land per m² of land · Niederweningen · 2025
+7450 %
since 1974
Line: median · band: middle 50%
All values as a table
| Year | Value | 25 % | 75 % | Cases |
|---|---|---|---|---|
| 2025 | 1,510 CHF/m² | 1,059 CHF/m² | 2,157 CHF/m² | 0 |
| 2024 | 1,469 CHF/m² | 1,030 CHF/m² | 2,094 CHF/m² | 0 |
| 2023 | 1,417 CHF/m² | 995 CHF/m² | 2,018 CHF/m² | 1 |
| 2022 | 1,355 CHF/m² | 951 CHF/m² | 1,927 CHF/m² | 1 |
| 2021 | 1,278 CHF/m² | 901 CHF/m² | 1,818 CHF/m² | 0 |
| 2020 | 1,195 CHF/m² | 844 CHF/m² | 1,698 CHF/m² | 0 |
| 2019 | 1,115 CHF/m² | 788 CHF/m² | 1,579 CHF/m² | 0 |
| 2018 | 1,039 CHF/m² | 736 CHF/m² | 1,472 CHF/m² | 3 |
| 2017 | 934 CHF/m² | – | – | 4 |
| 2016 | 909 CHF/m² | 645 CHF/m² | 1,285 CHF/m² | 2 |
| 2015 | 869 CHF/m² | 618 CHF/m² | 1,224 CHF/m² | 1 |
| 2014 | 1,046 CHF/m² | – | – | 4 |
| 2013 | 783 CHF/m² | 555 CHF/m² | 1,099 CHF/m² | 3 |
| 2012 | 522 CHF/m² | – | – | 4 |
| 2011 | 530 CHF/m² | – | – | 4 |
| 2010 | 650 CHF/m² | 600 CHF/m² | 700 CHF/m² | 7 |
| 2009 | 473 CHF/m² | 432 CHF/m² | 666 CHF/m² | 7 |
| 2008 | 500 CHF/m² | 445 CHF/m² | 510 CHF/m² | 8 |
| 2007 | 620 CHF/m² | 433 CHF/m² | 630 CHF/m² | 20 |
| 2006 | 570 CHF/m² | 519 CHF/m² | 630 CHF/m² | 8 |
| 2005 | 442 CHF/m² | 371 CHF/m² | 470 CHF/m² | 13 |
| 2004 | 496 CHF/m² | 394 CHF/m² | 585 CHF/m² | 6 |
| 2003 | 450 CHF/m² | 450 CHF/m² | 465 CHF/m² | 9 |
| 2002 | 515 CHF/m² | 511 CHF/m² | 572 CHF/m² | 6 |
| 2001 | 504 CHF/m² | 469 CHF/m² | 550 CHF/m² | 11 |
| 2000 | 514 CHF/m² | 450 CHF/m² | 524 CHF/m² | 26 |
| 1999 | 483 CHF/m² | 317 CHF/m² | 531 CHF/m² | 23 |
| 1998 | 459 CHF/m² | 459 CHF/m² | 496 CHF/m² | 52 |
| 1997 | 523 CHF/m² | 448 CHF/m² | 550 CHF/m² | 15 |
| 1996 | 525 CHF/m² | 386 CHF/m² | 696 CHF/m² | 3 |
| 1995 | 544 CHF/m² | 402 CHF/m² | 717 CHF/m² | 1 |
| 1994 | 562 CHF/m² | 418 CHF/m² | 737 CHF/m² | 1 |
| 1993 | 786 CHF/m² | 779 CHF/m² | 789 CHF/m² | 5 |
| 1992 | 534 CHF/m² | 398 CHF/m² | 698 CHF/m² | 2 |
| 1991 | 492 CHF/m² | 367 CHF/m² | 643 CHF/m² | 0 |
| 1990 | 280 CHF/m² | 139 CHF/m² | 523 CHF/m² | 7 |
| 1989 | 270 CHF/m² | 270 CHF/m² | 270 CHF/m² | 5 |
| 1988 | 139 CHF/m² | – | – | 4 |
| 1987 | 125 CHF/m² | 125 CHF/m² | 280 CHF/m² | 5 |
| 1986 | 220 CHF/m² | 165 CHF/m² | 288 CHF/m² | 3 |
| 1985 | 140 CHF/m² | 115 CHF/m² | 196 CHF/m² | 7 |
| 1984 | 160 CHF/m² | 145 CHF/m² | 205 CHF/m² | 6 |
| 1983 | 154 CHF/m² | 115 CHF/m² | 202 CHF/m² | 3 |
| 1982 | 167 CHF/m² | 70 CHF/m² | 168 CHF/m² | 12 |
| 1981 | 125 CHF/m² | 93 CHF/m² | 164 CHF/m² | 1 |
| 1980 | 110 CHF/m² | 80 CHF/m² | 137 CHF/m² | 28 |
| 1979 | 123 CHF/m² | 112 CHF/m² | 126 CHF/m² | 24 |
| 1978 | 90 CHF/m² | 57 CHF/m² | 123 CHF/m² | 19 |
| 1977 | 100 CHF/m² | 78 CHF/m² | 106 CHF/m² | 18 |
| 1976 | 92 CHF/m² | 69 CHF/m² | 121 CHF/m² | 1 |
| 1975 | 91 CHF/m² | 68 CHF/m² | 119 CHF/m² | 0 |
| 1974 | 20 CHF/m² | 12 CHF/m² | 46 CHF/m² | 7 |
Sale prices: Prices actually paid in property transfers · Official survey: Sample of existing tenancies · Full census: Official count · Asking prices: Prices from listings – not closing prices · Model value: Statistical estimate, no individual transactions.
Sources: Heimster, Angebotspreise auf Websites von Immobilienfirmen; Statistisches Amt Kanton Zürich, Handänderungsstatistik; BFS, Strukturerhebung (Durchschnitt aller bewohnten Mietwohnungen); Statistisches Amt Kanton Zürich, Leerwohnungszählung. Values apply to the area named, not to an individual building.
Population & jobs
- Residents (2025)
- 3,349
- Growth over 10 years
- +16.4%
- Share of foreign nationals
- 19.4%
- Share aged 65 and over
- 16.4%
- Jobs (2024)
- 916
- Income tax¹
- CHF 8,814
- Household electricity price (2027)
- from 23.9 Rp./kWh
Sources: FSO (STATPOP, STATENT), ElCom. ¹ Canton and municipality, single person, gross income of about CHF 100,000.
Residential buildings by construction period
- before 1919 65
- 1919–1945 27
- 1946–1970 81
- 1971–1990 135
- 1991–2010 311
- from 2011 125
Heating systems in the existing stock
- Heat pump 58%
- District heating 3%
- Heating oil 28%
- Wood 7%
Source: GWR, residential buildings in Niederweningen.
Streets compared
What is it like to live where in Niederweningen?
The quietest streets
- 1.Widemstrasse32 dB
- 2.In Hintereichen33 dB
- 3.Mustergass34 dB
- 4.Hintereichenstrasse36 dB
- 5.Steig36 dB
- 6.Tannrietlistrasse36 dB
- 7.Am Singelenbach38 dB
- 8.Hofwies38 dB
Shops & public transport on the doorstep
- 1.Alte Stationsstrasse110 m · 60 m
- 2.Alte Poststrasse70 m · 150 m
- 3.Mammutweg250 m · 150 m
- 4.Alte Dorfstrasse250 m · 160 m
- 5.Gumpenwisenstrasse250 m · 180 m
- 6.Austrasse280 m · 160 m
- 7.Ob der Müli190 m · 250 m
- 8.Sägeweg290 m · 170 m
Short walks to daycare & kindergarten
- 1.Alte Stationsstrasse70 m
- 2.Mammutweg100 m
- 3.Hüsliweg120 m
- 4.Gumpenwisenstrasse120 m
- 5.Im Binzacher140 m
- 6.Sägeweg150 m
- 7.Im Uwerd150 m
- 8.Oberer Hüsliweg160 m
Streets with at least three residential buildings; median of the buildings. Noise: loudest façade during the day (FOEN sonBASE); distances as the crow flies (OpenStreetMap, FOT).
Currently on Heimster
11 listings in Niederweningen
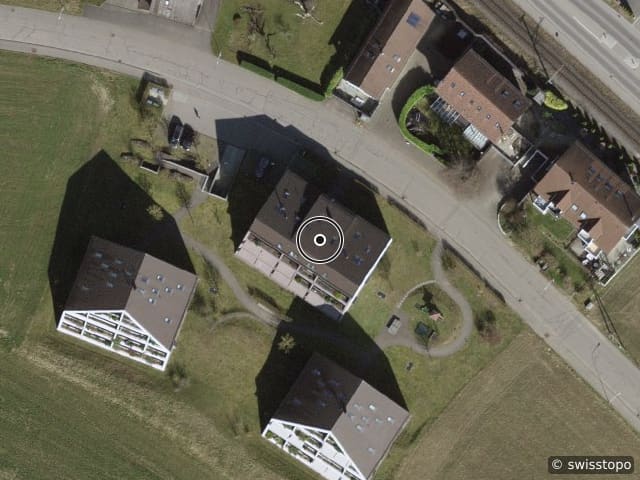
Buy
Mehr Raum zum Leben. Charmante 4.5-Zimmer-Duplexwohnung im EG/HP
CHF 1.23m
4.5 rooms · 152 m² · Niederweningen
Listing by smeyers Immobilien AG Basel
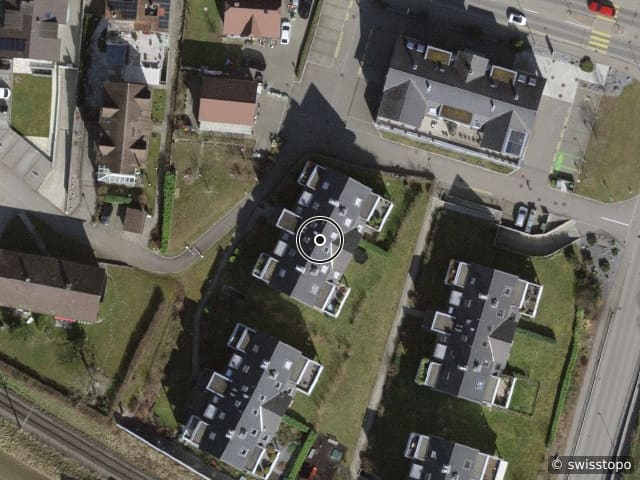
Buy
ZWEI EBENEN - ZWEI TERRASSEN - EIN ZUHAUSE
CHF 1.83m
7.5 rooms · 221 m² · Niederweningen
Listing by home2be Immobilien Consulting AG
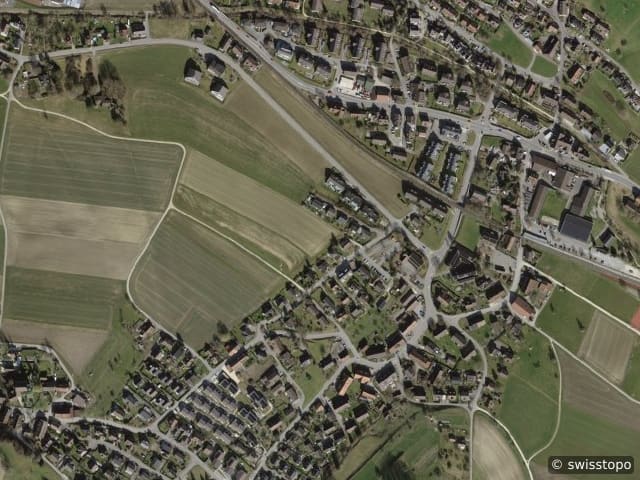
Buy
Moderne, möblierte 3.5-Zimmer-Wohnung mit grosszügigem Balkon in Niederweningen
CHF 1.13m
3.5 rooms · 100 m² · Niederweningen
Listing by GoodLiving AG
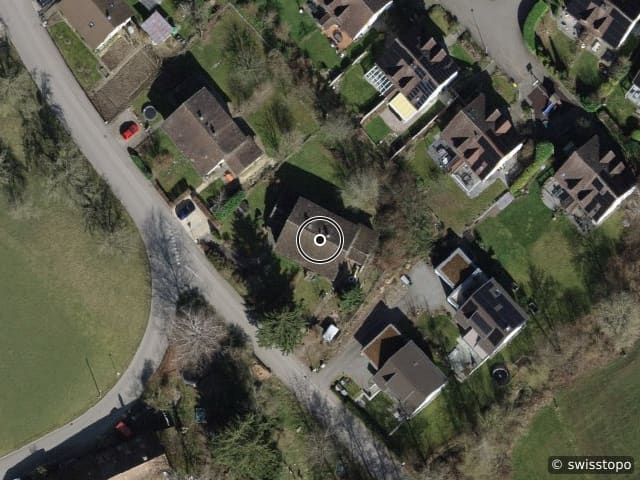
Buy
Zuhause im Grünen
CHF 1.72m
5.5 rooms · 195 m² · Niederweningen
Listing by Markstein AG
Buy
Licht, Raum und Privatsphäre - attraktive 5.5 Zimmerwohnung mit grosser Terrasse
CHF 1.25m
5.5 rooms · 136 m² · Niederweningen
Listing by smeyers Immobilien AG Basel
Buy
Doppeleinfamilienhaus im Wehntal
CHF 1.58m
5.5 rooms · 147 m² · Niederweningen
Listing by Daily Homes
New builds
What is being created in Niederweningen
36 new homes are under construction, approved or planned here – from the federal building register.
For owners
Your property at a glance.
Value it yourself and follow the value in your cockpit – or get advice from an experienced expert in your region. Both are free and without obligation.
Value it yourself – with an owner cockpit
Free, in about two minutes. Afterwards you follow the value for as long as you like.
Prefer personal advice?
An experienced agency from your region looks at your property, values it on site and supports the sale or letting – free and without obligation. We put you in touch.
Owner-occupied flats in Niederweningen were advertised at a median of 9,191 CHF per m² of living space in 2026 (11 listings, Asking prices).
- 1Send an enquiry – two minutes, no account.
- 2We get back to you within two working days and choose a suitable estate agency from your region.
- 3Personal assessment on site – free of charge and without obligation.
Streets
Streets in Niederweningen
61 streets with residential buildings – location, distances and noise for every building.