

Municipality in the Canton of Zurich
Living in Neftenbach
Neftenbach (postcode 8412–8413) has 1,382 residential buildings with 2,572 homes in total on 99 streets.
- homes
- 2,572
- with a supermarket ≤ 500 m
- 60%
- with public transport ≤ 300 m
- 80%
- in a quiet location
- 41%
Overview
Neftenbach in figures
- Neftenbach (postcode 8412–8413) has 1,382 residential buildings with 2,572 homes in total on 99 streets.
- The average construction year of the residential buildings is 1967.
- 60% of residential buildings have a supermarket within 500 m as the crow flies, 36% a daycare centre or kindergarten and 80% a public transport stop within 300 m.
- 41% of residential buildings are in a quiet location (below 50 dB during the day at the loudest façade).
- Building land in Neftenbach: Model value 2025 of 1,445 CHF per m² of land.
- Net rents in the Canton of Zurich are 21.30 CHF per m² per month (average, 2024; BFS, Strukturerhebung (Durchschnitt aller bewohnten Mietwohnungen)).
- Owner-occupied flats in Neftenbach sold at a median price of CHF 905,000 in 2025 (27 sales).
- Income tax (canton and municipality): about CHF 8,814 per year for a single person with a gross income of about CHF 100,000.
Find your address in Neftenbach
Market & people
Prices, population and building stock
Building land
Model value1,445 CHF/m²
per m² of land
Neftenbach · 2025
- Canton of Zurich1,742 CHF/m²
Rents
Official survey21.30 CHF/m²
per m² of living space per month, net
Canton of Zurich · 2024
Canton value – not published for Neftenbach
- Switzerland17.80 CHF/m²
Owner-occupied flats
Sale pricesCHF 905,000
per flat (median price)
Neftenbach · 2025 · 27 sales
- Canton of ZurichCHF 1.20m
Single-family houses
Sale pricesCHF 1.40m
per house (median price)
Neftenbach · 2023 · 15 sales
- Canton of ZurichCHF 1.59m
Vacancy rate
Full census0.43%
of dwellings are vacant
Neftenbach · 2026 · 11 vacant dwellings
- Canton of Zurich0.52%
1,445 CHF/m²
Building land per m² of land · Neftenbach · 2025
+1146 %
since 1974
Line: median · band: middle 50%
All values as a table
| Year | Value | 25 % | 75 % | Cases |
|---|---|---|---|---|
| 2025 | 1,445 CHF/m² | 1,021 CHF/m² | 2,038 CHF/m² | 0 |
| 2024 | 1,406 CHF/m² | 994 CHF/m² | 1,979 CHF/m² | 1 |
| 2023 | 1,551 CHF/m² | – | – | 4 |
| 2022 | 1,296 CHF/m² | 914 CHF/m² | 1,817 CHF/m² | 1 |
| 2021 | 1,222 CHF/m² | 862 CHF/m² | 1,707 CHF/m² | 3 |
| 2020 | 1,143 CHF/m² | 806 CHF/m² | 1,595 CHF/m² | 2 |
| 2019 | 636 CHF/m² | – | – | 4 |
| 2018 | 990 CHF/m² | 700 CHF/m² | 1,379 CHF/m² | 2 |
| 2017 | 919 CHF/m² | 651 CHF/m² | 1,282 CHF/m² | 0 |
| 2016 | 860 CHF/m² | 610 CHF/m² | 1,200 CHF/m² | 3 |
| 2015 | 819 CHF/m² | 582 CHF/m² | 1,145 CHF/m² | 0 |
| 2014 | 784 CHF/m² | 556 CHF/m² | 1,093 CHF/m² | 3 |
| 2013 | 826 CHF/m² | – | – | 4 |
| 2012 | 690 CHF/m² | 490 CHF/m² | 957 CHF/m² | 1 |
| 2011 | 696 CHF/m² | – | – | 4 |
| 2010 | 628 CHF/m² | 362 CHF/m² | 684 CHF/m² | 12 |
| 2009 | 550 CHF/m² | 264 CHF/m² | 665 CHF/m² | 29 |
| 2008 | 640 CHF/m² | 500 CHF/m² | 669 CHF/m² | 33 |
| 2007 | 500 CHF/m² | 450 CHF/m² | 570 CHF/m² | 21 |
| 2006 | 450 CHF/m² | 450 CHF/m² | 524 CHF/m² | 18 |
| 2005 | 560 CHF/m² | 519 CHF/m² | 720 CHF/m² | 13 |
| 2004 | 403 CHF/m² | 347 CHF/m² | 429 CHF/m² | 5 |
| 2003 | 354 CHF/m² | 286 CHF/m² | 500 CHF/m² | 9 |
| 2002 | 480 CHF/m² | 294 CHF/m² | 500 CHF/m² | 25 |
| 2001 | 505 CHF/m² | 366 CHF/m² | 701 CHF/m² | 3 |
| 2000 | 505 CHF/m² | 368 CHF/m² | 697 CHF/m² | 3 |
| 1999 | 364 CHF/m² | 363 CHF/m² | 370 CHF/m² | 16 |
| 1998 | 330 CHF/m² | – | – | 4 |
| 1997 | 505 CHF/m² | 374 CHF/m² | 682 CHF/m² | 0 |
| 1996 | 516 CHF/m² | 386 CHF/m² | 692 CHF/m² | 0 |
| 1995 | 720 CHF/m² | – | – | 4 |
| 1994 | 541 CHF/m² | 409 CHF/m² | 717 CHF/m² | 3 |
| 1993 | 550 CHF/m² | 550 CHF/m² | 563 CHF/m² | 5 |
| 1992 | 500 CHF/m² | – | – | 4 |
| 1991 | 653 CHF/m² | 507 CHF/m² | 728 CHF/m² | 8 |
| 1990 | 605 CHF/m² | 450 CHF/m² | 776 CHF/m² | 6 |
| 1989 | 450 CHF/m² | 382 CHF/m² | 461 CHF/m² | 20 |
| 1988 | 382 CHF/m² | 381 CHF/m² | 382 CHF/m² | 6 |
| 1987 | 241 CHF/m² | 188 CHF/m² | 264 CHF/m² | 8 |
| 1986 | 276 CHF/m² | 259 CHF/m² | 403 CHF/m² | 9 |
| 1985 | 230 CHF/m² | 220 CHF/m² | 239 CHF/m² | 44 |
| 1984 | 180 CHF/m² | 76 CHF/m² | 190 CHF/m² | 19 |
| 1983 | 181 CHF/m² | 138 CHF/m² | 241 CHF/m² | 1 |
| 1982 | 165 CHF/m² | 126 CHF/m² | 219 CHF/m² | 3 |
| 1981 | 92 CHF/m² | 62 CHF/m² | 100 CHF/m² | 6 |
| 1980 | 109 CHF/m² | 100 CHF/m² | 118 CHF/m² | 16 |
| 1979 | 125 CHF/m² | 110 CHF/m² | 125 CHF/m² | 34 |
| 1978 | 116 CHF/m² | 82 CHF/m² | 150 CHF/m² | 9 |
| 1977 | 111 CHF/m² | 108 CHF/m² | 115 CHF/m² | 57 |
| 1976 | 116 CHF/m² | 112 CHF/m² | 116 CHF/m² | 10 |
| 1975 | 129 CHF/m² | – | – | 4 |
| 1974 | 116 CHF/m² | 102 CHF/m² | 137 CHF/m² | 13 |
Sale prices: Prices actually paid in property transfers · Official survey: Sample of existing tenancies · Full census: Official count · Model value: Statistical estimate, no individual transactions.
Sources: Statistisches Amt Kanton Zürich, Handänderungsstatistik; BFS, Strukturerhebung (Durchschnitt aller bewohnten Mietwohnungen); Statistisches Amt Kanton Zürich, Leerwohnungszählung. Values apply to the area named, not to an individual building.
Population & jobs
- Residents (2025)
- 5,765
- Growth over 10 years
- +4.7%
- Share of foreign nationals
- 13.3%
- Share aged 65 and over
- 19.9%
- Jobs (2024)
- 1,729
- Income tax¹
- CHF 8,814
- Household electricity price (2027)
- from 23.9 Rp./kWh
Sources: FSO (STATPOP, STATENT), ElCom. ¹ Canton and municipality, single person, gross income of about CHF 100,000.
Residential buildings by construction period
- before 1919 212
- 1919–1945 38
- 1946–1970 125
- 1971–1990 442
- 1991–2010 424
- from 2011 141
Heating systems in the existing stock
- Heat pump 45%
- District heating 3%
- Heating oil 35%
- Wood 5%
Source: GWR, residential buildings in Neftenbach.
Streets compared
What is it like to live where in Neftenbach?
The quietest streets
- 1.Hinterhuebstrasse31 dB
- 2.Obere Hueb35 dB
- 3.Dättlikonstrasse40 dB
- 4.Sonnhaldenstrasse41 dB
- 5.Aspacherstrasse42 dB
- 6.Im Holzacher42 dB
- 7.Huebstrasse43 dB
- 8.Krähenweg43 dB
Shops & public transport on the doorstep
- 1.Mitteldorfweg40 m · 100 m
- 2.Tössallmendstrasse90 m · 120 m
- 3.Rankstrasse150 m · 170 m
- 4.Am Bach150 m · 180 m
- 5.Im Holzacher130 m · 210 m
- 6.Heimstättenweg180 m · 200 m
- 7.Zwischenweg180 m · 210 m
- 8.Alte Ziegelei210 m · 190 m
Short walks to daycare & kindergarten
- 1.Unterdorfstrasse70 m
- 2.Mühleweg140 m
- 3.Schulstrasse190 m
- 4.Rosackerstrasse220 m
- 5.Zürichstrasse230 m
- 6.Wartgutstrasse260 m
- 7.Ebnistrasse260 m
- 8.Herrgass320 m
Streets with at least three residential buildings; median of the buildings. Noise: loudest façade during the day (FOEN sonBASE); distances as the crow flies (OpenStreetMap, FOT).
Currently on Heimster
6 listings in Neftenbach
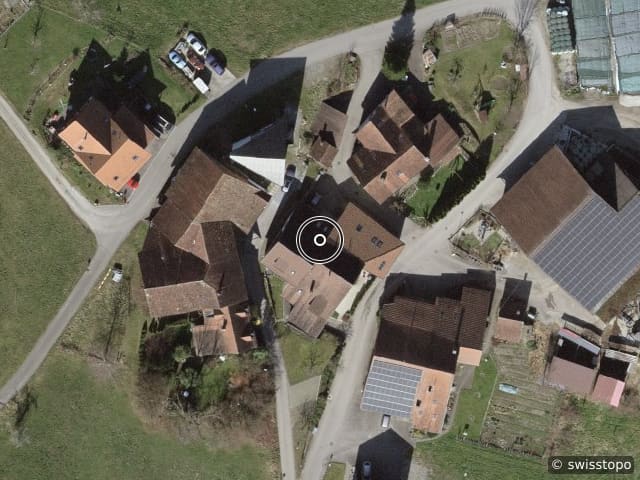
Buy
Historischer Charme, modern ausgebaut
CHF 949,000
4.5 rooms · 146 m² · Neftenbach
Listing by Hauseigentümerverband
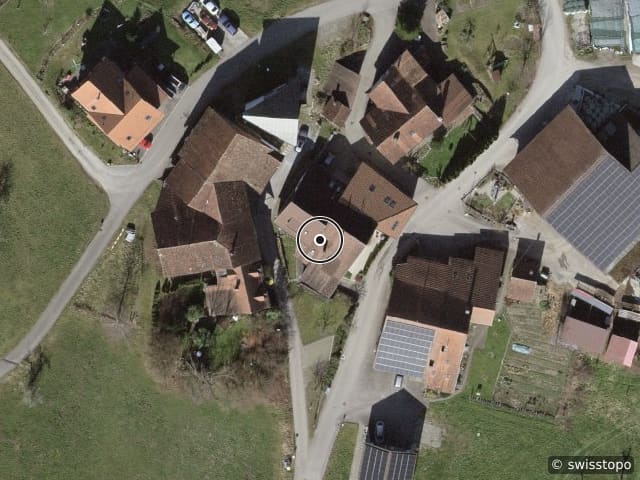
Buy
Zwei Jahrhunderte Geschichte - zwei Wohnungen
CHF 1.21m
234 m² · Neftenbach
Listing by Hauseigentümerverband
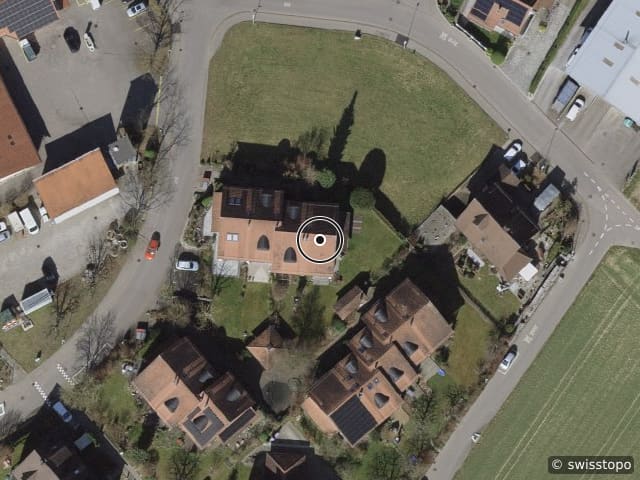
Buy
Viel Platz für die ganze Familie
CHF 1.17m
5.5 rooms · 122 m² · Neftenbach
Listing by Hauseigentümerverband
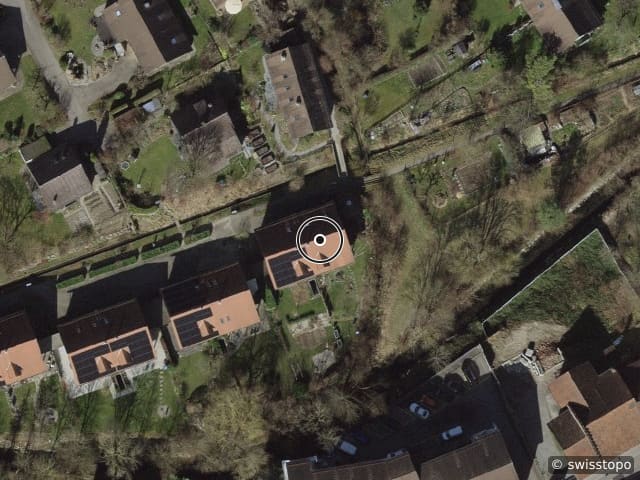
Buy
Idyllisches 5.5-Zi.-DEFH mit direktem Zugang zum Näfbach
Price on request
5.5 rooms · 170 m² · Neftenbach
Listing by RE/MAX Immobilien in Winterthur
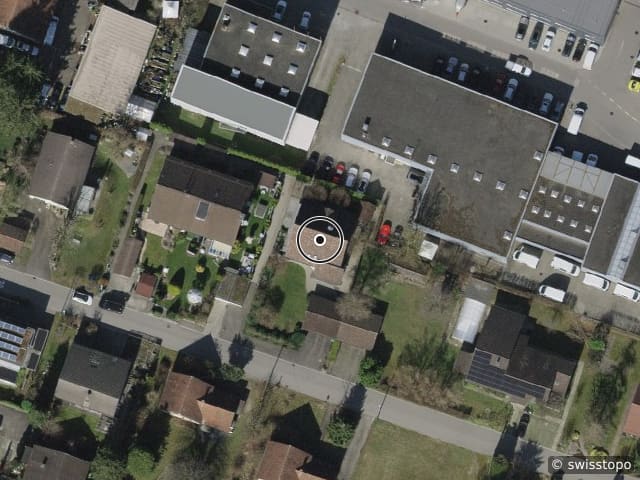
Buy
6.5 (7.5) -Zi.-EFH im Baurecht mit Garten und Doppelgarage
Price on request
7.5 rooms · 180 m² · Neftenbach
Listing by RE/MAX Immobilien in Winterthur
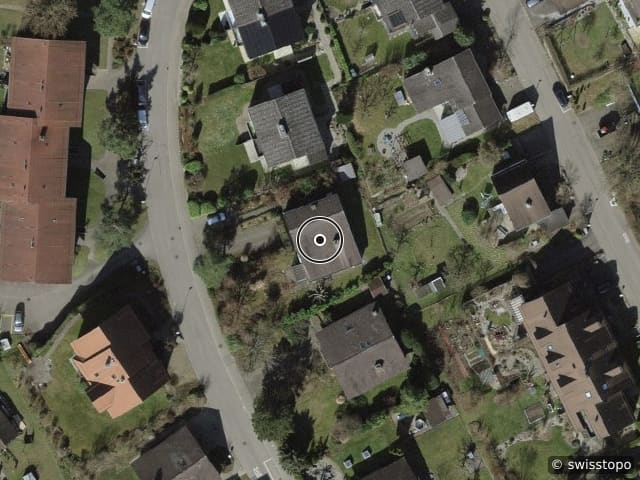
Buy
Eigentumswohnungen im Zentrum von Neftenbach
Price on request
Neftenbach
Listing by Wylandpark AG
New builds
What is being created in Neftenbach
69 new homes are under construction, approved or planned here – from the federal building register.
For owners
Your property at a glance.
Value it yourself and follow the value in your cockpit – or get advice from an experienced expert in your region. Both are free and without obligation.
Value it yourself – with an owner cockpit
Free, in about two minutes. Afterwards you follow the value for as long as you like.
Prefer personal advice?
An experienced agency from your region looks at your property, values it on site and supports the sale or letting – free and without obligation. We put you in touch.
Owner-occupied flats in Neftenbach sold at a median price of CHF 905,000 in 2025 (27 sales).
- 1Send an enquiry – two minutes, no account.
- 2We get back to you within two working days and choose a suitable estate agency from your region.
- 3Personal assessment on site – free of charge and without obligation.
Streets
Streets in Neftenbach
99 streets with residential buildings – location, distances and noise for every building.
A
- Alte Radhofstrasse · 7
- Alte Schaffhausenstrasse · 20
- Alte Ziegelei · 5
- Am Bach · 7
- Anna-Huber-Weg · 1
- Aspacherstrasse · 41
- Auenrainstrasse · 5
B
- Bertha Sprenger-Strasse · 1
- Brahaldenstrasse · 12
- Breitestrasse · 17
- Bruppachstrasse · 2
- Brüelweg · 6
- Burgstallstrasse · 8
C
- Chesselacherstrasse · 1
- Chlimbergstrasse · 24
- Chämiweg · 32
- Claisbergstrasse · 2
D
- Desibachstrasse · 2
- Dättlikonstrasse · 3
E
- Ebnistrasse · 10
- Ebniweg · 1
- Eichhofstrasse · 5
F
- Flaachtalstrasse · 15
- Friedhofstrasse · 3
- Fuchsbüelstrasse · 5
H
- Hagenbuchstrasse · 1
- Haldenweg · 22
- Haltenstrasse · 45
- Heimstättenweg · 19
- Henggartstrasse · 1
- Herrgass · 16
- Hettlingenstrasse · 10
- Himmerichstrasse · 1
- Hinterdorfstrasse · 16
- Hinterhuebstrasse · 10
- Hofstetten · 1
- Hofstettenstrasse · 7
- Huebstrasse · 6
I
- Im Asp · 1
- Im Buck · 2
- Im Holzacher · 11
- Im Höfli · 2
- Im Hüdel · 1
- Im Juch · 1
- Im Oberfeld · 1
- Im Schili · 1
- Im Schmittenacher · 15
- Im Wingert · 1
- Irchelstrasse · 1
K
- Karl-Bügler-Strasse · 2
- Kehlhofstrasse · 2
- Kirchweg · 8
- Klingenbergstrasse · 25
- Krähenweg · 4
L
M
- Mitteldorfweg · 4
- Mühleweg · 16
N
O
- Oberdorf · 19
- Obere Breiten · 15
- Obere Hueb · 3
- Oberwingertstrasse · 1
- Oedenhofstrasse · 3
- Oele · 2
- Oeleweg · 1
P
- Pünt · 1
R
- Radhofstrasse · 11
- Rankstrasse · 25
- Rebweg · 4
- Rietstrasse · 4
- Ringstrasse · 8
- Rosackerstrasse · 4
- Rosenweg · 16
- Rosswettistrasse · 9
- Rötelbodenstrasse · 2
- Rötelhochstrasse · 2
- Rötelstrasse · 34
S
- Sattleracherstrasse · 62
- Schaffhausenstrasse · 44
- Schulstrasse · 105
- Seuzachstrasse · 74
- Sonnhaldenstrasse · 28
- Steigstrasse · 1
T
- Talgut · 1
- Tössallmendstrasse · 21
- Tössstrasse · 8
- Tösswiesenstrasse · 18
U
- Unterdorfstrasse · 6
- Untere Breiten · 27
- Unterhuebstrasse · 1
W
- Wartgutstrasse · 55
- Weiachstrasse · 11
- Winterthurstrasse · 62
- Wolfzangenstrasse · 70
Z
- Zelgli · 10
- Zeughausstrasse · 9
- Zwischenweg · 24
- Zürichstrasse · 90