

Municipality in the Canton of Zurich
Living in Hinwil
Hinwil (postcode 8340–8498) has 2,393 residential buildings with 5,633 homes in total on 185 streets.
- homes
- 5,633
- with a supermarket ≤ 500 m
- 53%
- with public transport ≤ 300 m
- 68%
- in a quiet location
- 49%
Overview
Hinwil in figures
- Hinwil (postcode 8340–8498) has 2,393 residential buildings with 5,633 homes in total on 185 streets.
- The average construction year of the residential buildings is 1946.
- 53% of residential buildings have a supermarket within 500 m as the crow flies, 63% a daycare centre or kindergarten and 68% a public transport stop within 300 m.
- 49% of residential buildings are in a quiet location (below 50 dB during the day at the loudest façade).
- Building land in Hinwil: Model value 2025 of 1,264 CHF per m² of land.
- Net rents in the Canton of Zurich are 21.30 CHF per m² per month (average, 2024; BFS, Strukturerhebung (Durchschnitt aller bewohnten Mietwohnungen)).
- Owner-occupied flats in Hinwil sold at a median price of CHF 870,000 in 2025 (53 sales).
- Income tax (canton and municipality): about CHF 9,563 per year for a single person with a gross income of about CHF 100,000.
Find your address in Hinwil
Market & people
Prices, population and building stock
Building land
Model value1,264 CHF/m²
per m² of land
Hinwil · 2025
- Canton of Zurich1,742 CHF/m²
Rents
Official survey21.30 CHF/m²
per m² of living space per month, net
Canton of Zurich · 2024
Canton value – not published for Hinwil
- Switzerland17.80 CHF/m²
Owner-occupied flats
Sale pricesCHF 870,000
per flat (median price)
Hinwil · 2025 · 53 sales
- Canton of ZurichCHF 1.20m
Single-family houses
Sale pricesCHF 1.37m
per house (median price)
Hinwil · 2025 · 34 sales
- Canton of ZurichCHF 1.59m
Vacancy rate
Full census1.14%
of dwellings are vacant
Hinwil · 2026 · 64 vacant dwellings
- Canton of Zurich0.52%
1,264 CHF/m²
Building land per m² of land · Hinwil · 2025
+796 %
since 1974
Line: median · band: middle 50%
All values as a table
| Year | Value | 25 % | 75 % | Cases |
|---|---|---|---|---|
| 2025 | 1,264 CHF/m² | 895 CHF/m² | 1,770 CHF/m² | 3 |
| 2024 | 1,235 CHF/m² | 874 CHF/m² | 1,729 CHF/m² | 3 |
| 2023 | 1,030 CHF/m² | – | – | 4 |
| 2022 | 1,362 CHF/m² | – | – | 4 |
| 2021 | 1,098 CHF/m² | 778 CHF/m² | 1,539 CHF/m² | 0 |
| 2020 | 1,214 CHF/m² | – | – | 4 |
| 2019 | 1,422 CHF/m² | 697 CHF/m² | 1,645 CHF/m² | 8 |
| 2018 | 960 CHF/m² | 943 CHF/m² | 1,065 CHF/m² | 6 |
| 2017 | 717 CHF/m² | – | – | 4 |
| 2016 | 1,326 CHF/m² | 922 CHF/m² | 1,697 CHF/m² | 8 |
| 2015 | 554 CHF/m² | 512 CHF/m² | 739 CHF/m² | 6 |
| 2014 | 564 CHF/m² | 262 CHF/m² | 730 CHF/m² | 5 |
| 2013 | 722 CHF/m² | 514 CHF/m² | 1,010 CHF/m² | 3 |
| 2012 | 685 CHF/m² | 489 CHF/m² | 959 CHF/m² | 3 |
| 2011 | 750 CHF/m² | 429 CHF/m² | 897 CHF/m² | 7 |
| 2010 | 621 CHF/m² | 442 CHF/m² | 868 CHF/m² | 3 |
| 2009 | 613 CHF/m² | 280 CHF/m² | 650 CHF/m² | 10 |
| 2008 | 509 CHF/m² | 381 CHF/m² | 674 CHF/m² | 12 |
| 2007 | 725 CHF/m² | 698 CHF/m² | 782 CHF/m² | 10 |
| 2006 | 559 CHF/m² | – | – | 4 |
| 2005 | 570 CHF/m² | 553 CHF/m² | 683 CHF/m² | 31 |
| 2004 | 500 CHF/m² | 499 CHF/m² | 561 CHF/m² | 22 |
| 2003 | 460 CHF/m² | 419 CHF/m² | 600 CHF/m² | 15 |
| 2002 | 500 CHF/m² | 441 CHF/m² | 638 CHF/m² | 9 |
| 2001 | 443 CHF/m² | 413 CHF/m² | 589 CHF/m² | 20 |
| 2000 | 409 CHF/m² | 372 CHF/m² | 568 CHF/m² | 25 |
| 1999 | 400 CHF/m² | 400 CHF/m² | 460 CHF/m² | 21 |
| 1998 | 450 CHF/m² | 390 CHF/m² | 558 CHF/m² | 13 |
| 1997 | 589 CHF/m² | 341 CHF/m² | 687 CHF/m² | 24 |
| 1996 | 484 CHF/m² | 348 CHF/m² | 550 CHF/m² | 13 |
| 1995 | 555 CHF/m² | 473 CHF/m² | 630 CHF/m² | 16 |
| 1994 | 544 CHF/m² | 412 CHF/m² | 754 CHF/m² | 22 |
| 1993 | 480 CHF/m² | 447 CHF/m² | 480 CHF/m² | 7 |
| 1992 | 544 CHF/m² | 413 CHF/m² | 721 CHF/m² | 0 |
| 1991 | 850 CHF/m² | 766 CHF/m² | 922 CHF/m² | 10 |
| 1990 | 468 CHF/m² | 356 CHF/m² | 620 CHF/m² | 2 |
| 1989 | 450 CHF/m² | 328 CHF/m² | 754 CHF/m² | 12 |
| 1988 | 600 CHF/m² | 450 CHF/m² | 600 CHF/m² | 7 |
| 1987 | 295 CHF/m² | – | – | 4 |
| 1986 | 207 CHF/m² | 100 CHF/m² | 232 CHF/m² | 16 |
| 1985 | 250 CHF/m² | 200 CHF/m² | 255 CHF/m² | 52 |
| 1984 | 220 CHF/m² | 189 CHF/m² | 220 CHF/m² | 27 |
| 1983 | 190 CHF/m² | 155 CHF/m² | 195 CHF/m² | 44 |
| 1982 | 150 CHF/m² | 150 CHF/m² | 150 CHF/m² | 80 |
| 1981 | 165 CHF/m² | 141 CHF/m² | 172 CHF/m² | 71 |
| 1980 | 145 CHF/m² | 125 CHF/m² | 156 CHF/m² | 34 |
| 1979 | 122 CHF/m² | 100 CHF/m² | 149 CHF/m² | 110 |
| 1978 | 121 CHF/m² | 120 CHF/m² | 123 CHF/m² | 106 |
| 1977 | 121 CHF/m² | 113 CHF/m² | 128 CHF/m² | 108 |
| 1976 | 84 CHF/m² | 69 CHF/m² | 102 CHF/m² | 24 |
| 1975 | 100 CHF/m² | 68 CHF/m² | 131 CHF/m² | 37 |
| 1974 | 141 CHF/m² | 123 CHF/m² | 155 CHF/m² | 22 |
Sale prices: Prices actually paid in property transfers · Official survey: Sample of existing tenancies · Full census: Official count · Model value: Statistical estimate, no individual transactions.
Sources: Statistisches Amt Kanton Zürich, Handänderungsstatistik; BFS, Strukturerhebung (Durchschnitt aller bewohnten Mietwohnungen); Statistisches Amt Kanton Zürich, Leerwohnungszählung. Values apply to the area named, not to an individual building.
Population & jobs
- Residents (2025)
- 11,961
- Growth over 10 years
- +10.8%
- Share of foreign nationals
- 19.8%
- Share aged 65 and over
- 21.2%
- Jobs (2024)
- 7,763
- Income tax¹
- CHF 9,563
- Household electricity price (2027)
- from 23.9 Rp./kWh
Sources: FSO (STATPOP, STATENT), ElCom. ¹ Canton and municipality, single person, gross income of about CHF 100,000.
Residential buildings by construction period
- before 1919 553
- 1919–1945 87
- 1946–1970 434
- 1971–1990 639
- 1991–2010 475
- from 2011 201
Heating systems in the existing stock
- Heat pump 31%
- District heating 6%
- Gas 11%
- Heating oil 38%
- Wood 11%
Source: GWR, residential buildings in Hinwil.
Streets compared
What is it like to live where in Hinwil?
The quietest streets
- 1.Moosstrasse22 dB
- 2.Bodenacherstrasse28 dB
- 3.Hörnlistrasse28 dB
- 4.Schaugenstrasse33 dB
- 5.Huebweg35 dB
- 6.Riedmattstrasse35 dB
- 7.Eggstrasse36 dB
- 8.Im Bodenholz37 dB
Shops & public transport on the doorstep
- 1.Alte Zihlstrasse90 m · 110 m
- 2.Im Tobel140 m · 110 m
- 3.In der Gass140 m · 120 m
- 4.Bahnhofstrasse180 m · 80 m
- 5.Wässeristrasse190 m · 80 m
- 6.Edikerstrasse140 m · 130 m
- 7.Oberer Zelgweg200 m · 80 m
- 8.Bahnhofplatz220 m · 70 m
Short walks to daycare & kindergarten
Streets with at least three residential buildings; median of the buildings. Noise: loudest façade during the day (FOEN sonBASE); distances as the crow flies (OpenStreetMap, FOT).
New builds
What is being created in Hinwil
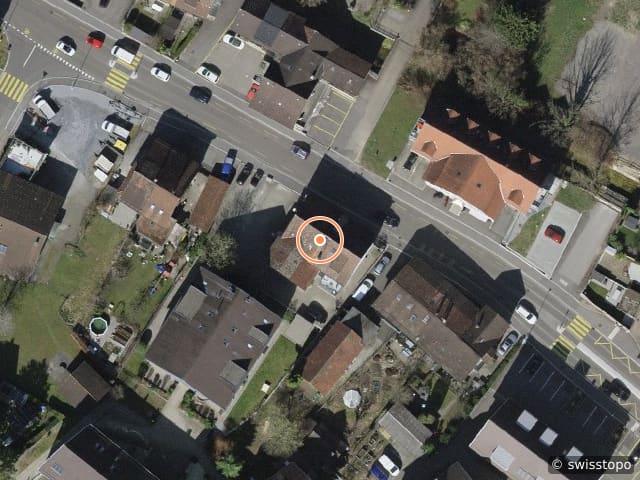
228 new homes are under construction, approved or planned here – from the federal building register.
 On the market
Zürichstrasse 17
Hinwil
1 offer · 3.5 rooms · from CHF 870'000
Offered by Früh Immobilien Dienstleistungen AG
Kemptnerstrasse 1
Hinwil
4 flats · Ready to move in since October 2026
Zürichstrasse 50
Hinwil
22 flats
Hanflandstrasse
Hinwil
15 flats
Quiet side
For owners
Your property at a glance.
Value it yourself and follow the value in your cockpit – or get advice from an experienced expert in your region. Both are free and without obligation.
Value it yourself – with an owner cockpit
Free, in about two minutes. Afterwards you follow the value for as long as you like.
Prefer personal advice?
An experienced agency from your region looks at your property, values it on site and supports the sale or letting – free and without obligation. We put you in touch.
Owner-occupied flats in Hinwil sold at a median price of CHF 870,000 in 2025 (53 sales).
- 1Send an enquiry – two minutes, no account.
- 2We get back to you within two working days and choose a suitable estate agency from your region.
- 3Personal assessment on site – free of charge and without obligation.
Streets
Streets in Hinwil
185 streets with residential buildings – location, distances and noise for every building.