

Municipality in the Canton of Zurich
Living in Fällanden
Fällanden (postcode 8117–8121) has 1,420 residential buildings with 4,422 homes in total on 93 streets.
- homes
- 4,422
- with a supermarket ≤ 500 m
- 60%
- with public transport ≤ 300 m
- 91%
- in a quiet location
- 45%
Overview
Fällanden in figures
- Fällanden (postcode 8117–8121) has 1,420 residential buildings with 4,422 homes in total on 93 streets.
- The average construction year of the residential buildings is 1976.
- 60% of residential buildings have a supermarket within 500 m as the crow flies, 66% a daycare centre or kindergarten and 91% a public transport stop within 300 m.
- 45% of residential buildings are in a quiet location (below 50 dB during the day at the loudest façade).
- Building land in Fällanden: Model value 2025 of 1,765 CHF per m² of land.
- Net rents in the Canton of Zurich are 21.30 CHF per m² per month (average, 2024; BFS, Strukturerhebung (Durchschnitt aller bewohnten Mietwohnungen)).
- Owner-occupied flats in Fällanden sold at a median price of CHF 1.10m in 2025 (36 sales).
- Income tax (canton and municipality): about CHF 8,682 per year for a single person with a gross income of about CHF 100,000.
Find your address in Fällanden
Market & people
Prices, population and building stock
Building land
Model value1,765 CHF/m²
per m² of land
Fällanden · 2025
- Canton of Zurich1,742 CHF/m²
Rents
Official survey21.30 CHF/m²
per m² of living space per month, net
Canton of Zurich · 2024
Canton value – not published for Fällanden
- Switzerland17.80 CHF/m²
Owner-occupied flats
Sale pricesCHF 1.10m
per flat (median price)
Fällanden · 2025 · 36 sales
- Canton of ZurichCHF 1.20m
Single-family houses
Sale pricesCHF 1.59m
per house (median price)
Canton of Zurich · 2025 · 2,248 sales
Canton value – not published for Fällanden
Vacancy rate
Full census1.68%
of dwellings are vacant
Fällanden · 2026 · 74 vacant dwellings
- Canton of Zurich0.52%
1,765 CHF/m²
Building land per m² of land · Fällanden · 2025
+932 %
since 1974
Line: median · band: middle 50%
All values as a table
| Year | Value | 25 % | 75 % | Cases |
|---|---|---|---|---|
| 2025 | 1,765 CHF/m² | 1,247 CHF/m² | 2,528 CHF/m² | 2 |
| 2024 | 1,715 CHF/m² | 1,212 CHF/m² | 2,455 CHF/m² | 0 |
| 2023 | 1,652 CHF/m² | 1,169 CHF/m² | 2,363 CHF/m² | 2 |
| 2022 | 1,576 CHF/m² | 1,117 CHF/m² | 2,254 CHF/m² | 2 |
| 2021 | 1,485 CHF/m² | 1,054 CHF/m² | 2,121 CHF/m² | 1 |
| 2020 | 1,386 CHF/m² | 982 CHF/m² | 1,974 CHF/m² | 0 |
| 2019 | 104 CHF/m² | 52 CHF/m² | 1,124 CHF/m² | 7 |
| 2018 | 1,195 CHF/m² | 848 CHF/m² | 1,699 CHF/m² | 1 |
| 2017 | 1,707 CHF/m² | 1,650 CHF/m² | 1,951 CHF/m² | 9 |
| 2016 | 1,041 CHF/m² | 738 CHF/m² | 1,470 CHF/m² | 3 |
| 2015 | 993 CHF/m² | 704 CHF/m² | 1,401 CHF/m² | 3 |
| 2014 | 1,210 CHF/m² | 1,045 CHF/m² | 1,299 CHF/m² | 6 |
| 2013 | 890 CHF/m² | 631 CHF/m² | 1,252 CHF/m² | 2 |
| 2012 | 835 CHF/m² | 592 CHF/m² | 1,173 CHF/m² | 2 |
| 2011 | 818 CHF/m² | – | – | 4 |
| 2010 | 740 CHF/m² | 524 CHF/m² | 1,035 CHF/m² | 1 |
| 2009 | 700 CHF/m² | 495 CHF/m² | 978 CHF/m² | 0 |
| 2008 | 667 CHF/m² | 473 CHF/m² | 932 CHF/m² | 2 |
| 2007 | 555 CHF/m² | 325 CHF/m² | 575 CHF/m² | 7 |
| 2006 | 587 CHF/m² | 578 CHF/m² | 810 CHF/m² | 5 |
| 2005 | 638 CHF/m² | 620 CHF/m² | 638 CHF/m² | 11 |
| 2004 | 622 CHF/m² | 600 CHF/m² | 622 CHF/m² | 5 |
| 2003 | 749 CHF/m² | 571 CHF/m² | 813 CHF/m² | 6 |
| 2002 | 686 CHF/m² | 612 CHF/m² | 745 CHF/m² | 22 |
| 2001 | 664 CHF/m² | 481 CHF/m² | 915 CHF/m² | 2 |
| 2000 | 579 CHF/m² | 513 CHF/m² | 613 CHF/m² | 11 |
| 1999 | 367 CHF/m² | 80 CHF/m² | 746 CHF/m² | 9 |
| 1998 | 644 CHF/m² | 472 CHF/m² | 871 CHF/m² | 1 |
| 1997 | 658 CHF/m² | 486 CHF/m² | 883 CHF/m² | 2 |
| 1996 | 656 CHF/m² | 484 CHF/m² | 878 CHF/m² | 1 |
| 1995 | 671 CHF/m² | 497 CHF/m² | 895 CHF/m² | 1 |
| 1994 | 698 CHF/m² | 520 CHF/m² | 925 CHF/m² | 0 |
| 1993 | 704 CHF/m² | 526 CHF/m² | 932 CHF/m² | 0 |
| 1992 | 672 CHF/m² | 503 CHF/m² | 889 CHF/m² | 2 |
| 1991 | 628 CHF/m² | 470 CHF/m² | 829 CHF/m² | 2 |
| 1990 | 577 CHF/m² | 433 CHF/m² | 762 CHF/m² | 3 |
| 1989 | 504 CHF/m² | 378 CHF/m² | 666 CHF/m² | 1 |
| 1988 | 311 CHF/m² | – | – | 4 |
| 1987 | 380 CHF/m² | 286 CHF/m² | 503 CHF/m² | 3 |
| 1986 | 280 CHF/m² | 205 CHF/m² | 288 CHF/m² | 6 |
| 1985 | 328 CHF/m² | 307 CHF/m² | 335 CHF/m² | 74 |
| 1984 | 316 CHF/m² | 298 CHF/m² | 350 CHF/m² | 25 |
| 1983 | 274 CHF/m² | 248 CHF/m² | 317 CHF/m² | 59 |
| 1982 | 272 CHF/m² | 241 CHF/m² | 272 CHF/m² | 121 |
| 1981 | 200 CHF/m² | 200 CHF/m² | 200 CHF/m² | 68 |
| 1980 | 136 CHF/m² | 121 CHF/m² | 200 CHF/m² | 87 |
| 1979 | 186 CHF/m² | 170 CHF/m² | 187 CHF/m² | 33 |
| 1978 | 171 CHF/m² | 153 CHF/m² | 171 CHF/m² | 40 |
| 1977 | 130 CHF/m² | 111 CHF/m² | 150 CHF/m² | 16 |
| 1976 | 125 CHF/m² | 110 CHF/m² | 170 CHF/m² | 35 |
| 1975 | 180 CHF/m² | 151 CHF/m² | 192 CHF/m² | 12 |
| 1974 | 171 CHF/m² | 151 CHF/m² | 296 CHF/m² | 8 |
Sale prices: Prices actually paid in property transfers · Official survey: Sample of existing tenancies · Full census: Official count · Model value: Statistical estimate, no individual transactions.
Sources: Statistisches Amt Kanton Zürich, Handänderungsstatistik; BFS, Strukturerhebung (Durchschnitt aller bewohnten Mietwohnungen); Statistisches Amt Kanton Zürich, Leerwohnungszählung. Values apply to the area named, not to an individual building.
Population & jobs
- Residents (2025)
- 9,637
- Growth over 10 years
- +17.6%
- Share of foreign nationals
- 25.8%
- Share aged 65 and over
- 18.5%
- Jobs (2024)
- 3,150
- Income tax¹
- CHF 8,682
- Household electricity price (2027)
- from 29.2 Rp./kWh
Sources: FSO (STATPOP, STATENT), ElCom. ¹ Canton and municipality, single person, gross income of about CHF 100,000.
Residential buildings by construction period
- before 1919 86
- 1919–1945 12
- 1946–1970 376
- 1971–1990 524
- 1991–2010 307
- from 2011 115
Heating systems in the existing stock
- Heat pump 28%
- District heating 2%
- Gas 35%
- Heating oil 29%
- Wood 2%
Source: GWR, residential buildings in Fällanden.
Streets compared
What is it like to live where in Fällanden?
The quietest streets
- 1.Waldstrasse41 dB
- 2.Bodenacherstrasse42 dB
- 3.In der Rehweid43 dB
- 4.Lohzelgstrasse43 dB
- 5.Sonnenhof43 dB
- 6.Sonnhalde43 dB
- 7.Weidstrasse43 dB
- 8.Huebwisstrasse44 dB
Shops & public transport on the doorstep
- 1.Wigartenstrasse60 m · 60 m
- 2.Fröschbach90 m · 100 m
- 3.Schulhausstrasse60 m · 150 m
- 4.Im Haufland120 m · 100 m
- 5.Föhrenweg120 m · 130 m
- 6.Dorfgass190 m · 70 m
- 7.Unterdorfstrasse100 m · 170 m
- 8.Kehrstrasse170 m · 110 m
Short walks to daycare & kindergarten
- 1.Baumgartenstrasse50 m
- 2.Alte Zürichstrasse100 m
- 3.Benglenstrasse110 m
- 4.Sandacherstrasse110 m
- 5.Twäracherstrasse120 m
- 6.Lindenweg140 m
- 7.Pfaffensteinstrasse150 m
- 8.Schulhausstrasse150 m
Streets with at least three residential buildings; median of the buildings. Noise: loudest façade during the day (FOEN sonBASE); distances as the crow flies (OpenStreetMap, FOT).
Currently on Heimster
6 listings in Fällanden

Buy
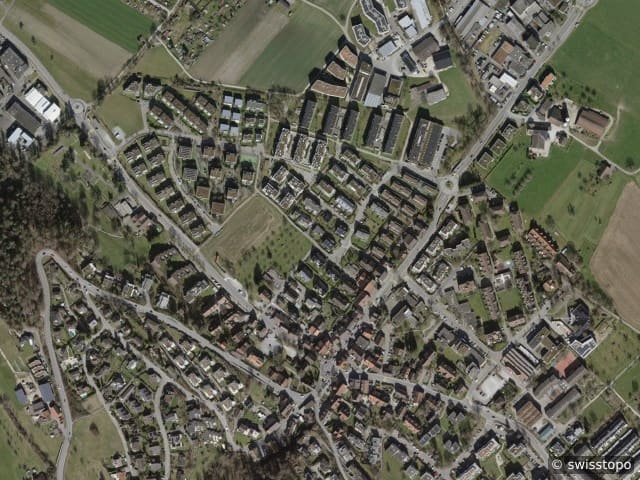
Neubau: Historischer Charme mit grosszügigem Wohngefühl
CHF 1.49m
3.5 rooms · 162 m² · Fällanden
Listing by Heer Real Estate AG
Buy
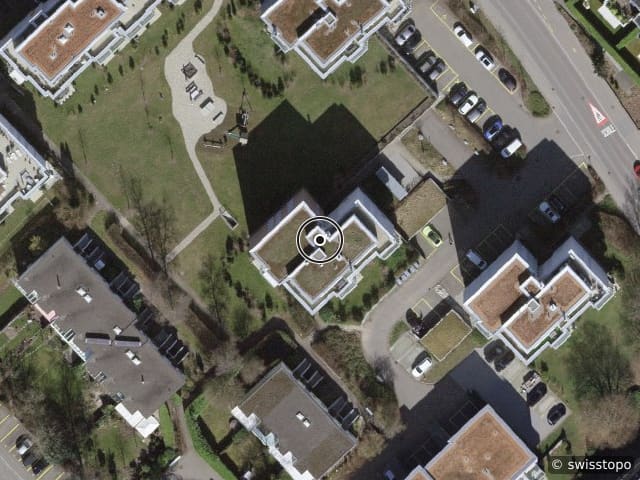
Neubau: Ein Zuhause voller Raum und Lebensqualität
CHF 1.94m
5 rooms · 163 m² · Fällanden
Listing by Heer Real Estate AG
Rent
4 Zimmer Wohnung zum Mieten in Fällanden Familienwohnung sucht neue Bewohner
Price on request
4 rooms · 85 m² · Fällanden
Listing by iCasa
Buy
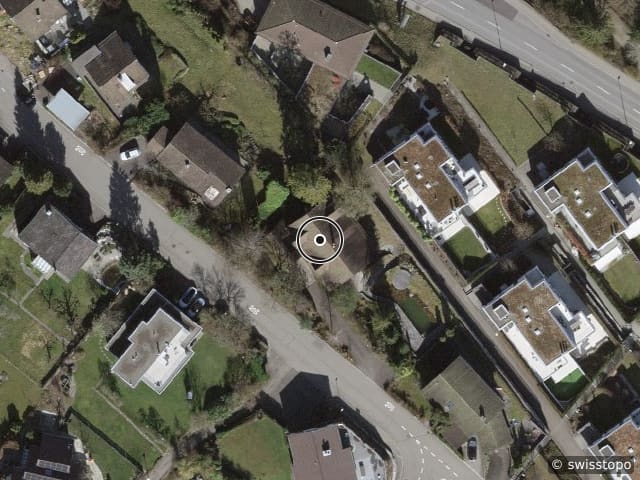
Neubau: Moderne Architektur mit viel Raum
CHF 1.59m
4.5 rooms · 125 m² · Fällanden
Listing by Heer Real Estate AG
Buy
Ausdruckstarkes Traumhaus mit atemberaubender Aussicht
CHF 3.80m
7.5 rooms · 247 m² · Fällanden
Listing by Walde Immobilien AG
Buy
Ihr Projekt - aus Alt mach Neu - 4 1/2 Zimmer Wohnung mit Potential
CHF 790,000
4.5 rooms · 95 m² · Pfaffhausen
Listing by Plüer & Partner Immobilien AG
New builds
What is being created in Fällanden
42 new homes are under construction, approved or planned here – from the federal building register.
Zürichstrasse 78
Fällanden
7 flats · Ready to move in since October 2026
Public transport class B
Schüepwisstrasse 24–28
Fällanden
12 flats
Public transport class B
Witikonstrasse 2
Fällanden
4 flats
Public transport class B
Im Meyerhof 7
Fällanden
10 flats
Public transport class B
For owners
Your property at a glance.
Value it yourself and follow the value in your cockpit – or get advice from an experienced expert in your region. Both are free and without obligation.
Value it yourself – with an owner cockpit
Free, in about two minutes. Afterwards you follow the value for as long as you like.
Prefer personal advice?
An experienced agency from your region looks at your property, values it on site and supports the sale or letting – free and without obligation. We put you in touch.
Owner-occupied flats in Fällanden sold at a median price of CHF 1.10m in 2025 (36 sales).
- 1Send an enquiry – two minutes, no account.
- 2We get back to you within two working days and choose a suitable estate agency from your region.
- 3Personal assessment on site – free of charge and without obligation.
Streets
Streets in Fällanden
93 streets with residential buildings – location, distances and noise for every building.
A
- Alte Zürichstrasse · 28
- Am Mülirain · 15
- Am Zilbach · 2
B
- Bachtelweg · 10
- Baumgartenstrasse · 11
- Benglenstrasse · 14
- Bergstrasse · 23
- Binzstrasse · 3
- Bodenacherstrasse · 96
- Bollenrütiweg · 3
- Brandholzstrasse · 5
- Breitistrasse · 7
- Bruggacherstrasse · 6
- Brunnenhof · 16
- Buchenweg · 14
- Buechwisstrasse · 14
C
D
- Dorfgass · 3
- Dübendorfstrasse · 29
E
- Ebmatingerweg · 1
- Egglerstrasse · 14
- Eichenweg · 15
- Eichwiswäg · 1
F
- Fröschbach · 57
- Föhrenweg · 22
G
- Gartewäg · 1
- Geerenstrasse · 8
- Geren · 6
- Gerlisbrunnenstrasse · 40
- Glärnischstrasse · 13
- Grossplatzstrasse · 39
- Gättenhusenstrasse · 21
H
- Hopplenweg · 6
- Huebwis · 1
- Huebwisstrasse · 14
I
- Im Breiteli · 16
- Im Gatter · 7
- Im Haufland · 9
- Im Meyerhof · 3
- Im Rebacher · 13
- Im Rohr · 2
- Im Rüeblig · 9
- In der Breiti · 1
- In der Müseren · 8
- In der Rehweid · 12
- Industriestrasse · 9
K
- Kehrstrasse · 5
L
- Langäristrasse · 79
- Letzacherstrasse · 35
- Lindenweg · 12
- Lohzelgstrasse · 7
M
- Maurstrasse · 58
- Mooswiesstrasse · 11
O
- Oberdorfstrasse · 19
- Oberdorfweg · 1
- Obstgarten · 20
P
- Pfaffensteinstrasse · 77
- Pfaffenwis · 12
R
- Rautiweg · 3
- Rebacherstrasse · 7
- Rütistrasse · 6
S
- Sagiwäg · 3
- Sandacherstrasse · 5
- Schulhausstrasse · 5
- Schwandlenstrasse · 1
- Schwerzenbachstrasse · 37
- Schüepwisstrasse · 27
- Schüracher · 1
- Sonnenhof · 27
- Sonnhalde · 30
- Stocklen · 1
- Sunnetalstrasse · 21
- Sunnewäg · 1
- Sängglen · 1
- Sängglenstrasse · 24
- Säntisstrasse · 13
T
- Talgartenstrasse · 7
- Toktergass · 4
- Twäracherstrasse · 13
- Tämperlistrasse · 6
U
- Unterdorfstrasse · 17
- Unterdorfwäg · 23
- Untere Halden · 1
- Unterer Rain · 9
W
- Waldstrasse · 11
- Weidstrasse · 5
- Wigartenstrasse · 5
- Witikonstrasse · 22
Z
- Ziegelhüttenweg · 1
- Zilstrasse · 11
- Zürich-Fussweg · 5
- Zürichstrasse · 66